
Health Insurance Cost Prediction and Regression
Insurance-Cost-Prediction Health Insurance Cost Prediction and Regression
Read More


Published on Nov 19, 2022 by Samer on Analysis
Data is the lifeblood of many organizations and the quality of that data can greatly impact the decisions made from it. The process of cleaning and transforming data is known as data wrangling, and it is a critical step in preparing data for analysis and reporting. SQL and Power BI are two powerful tools that can be used together to clean and visualize data, providing businesses with valuable insights.
SQL for Data Cleaning
SQL (Structured Query Language) is a powerful language for managing and manipulating data stored in relational databases. It provides a set of commands for performing operations such as filtering, sorting, aggregating, and joining data. In data cleaning, SQL can be used to identify and remove errors, inconsistencies, and duplicate data.
One common data cleaning task is removing duplicates. This can be done using the SELECT DISTINCT command, which returns only unique records in a table. For example, if a table contains multiple records for the same customer, the SELECT DISTINCT command can be used to remove the duplicates and return only one record for each unique customer.
Another data cleaning task that can be performed with SQL is handling missing values. This is often accomplished through imputation, which involves replacing missing values with an estimate based on the values of other records. For example, if a customer’s age is missing, the average age of customers with similar characteristics can be used to fill in the missing value.
SQL can also be used to standardize and normalize data, which is the process of converting data into a consistent format. This can involve converting data into a common date or time format, converting data into a consistent case (such as all uppercase or all lowercase), and converting data into a consistent measurement unit.
Power BI for Visualizing Data
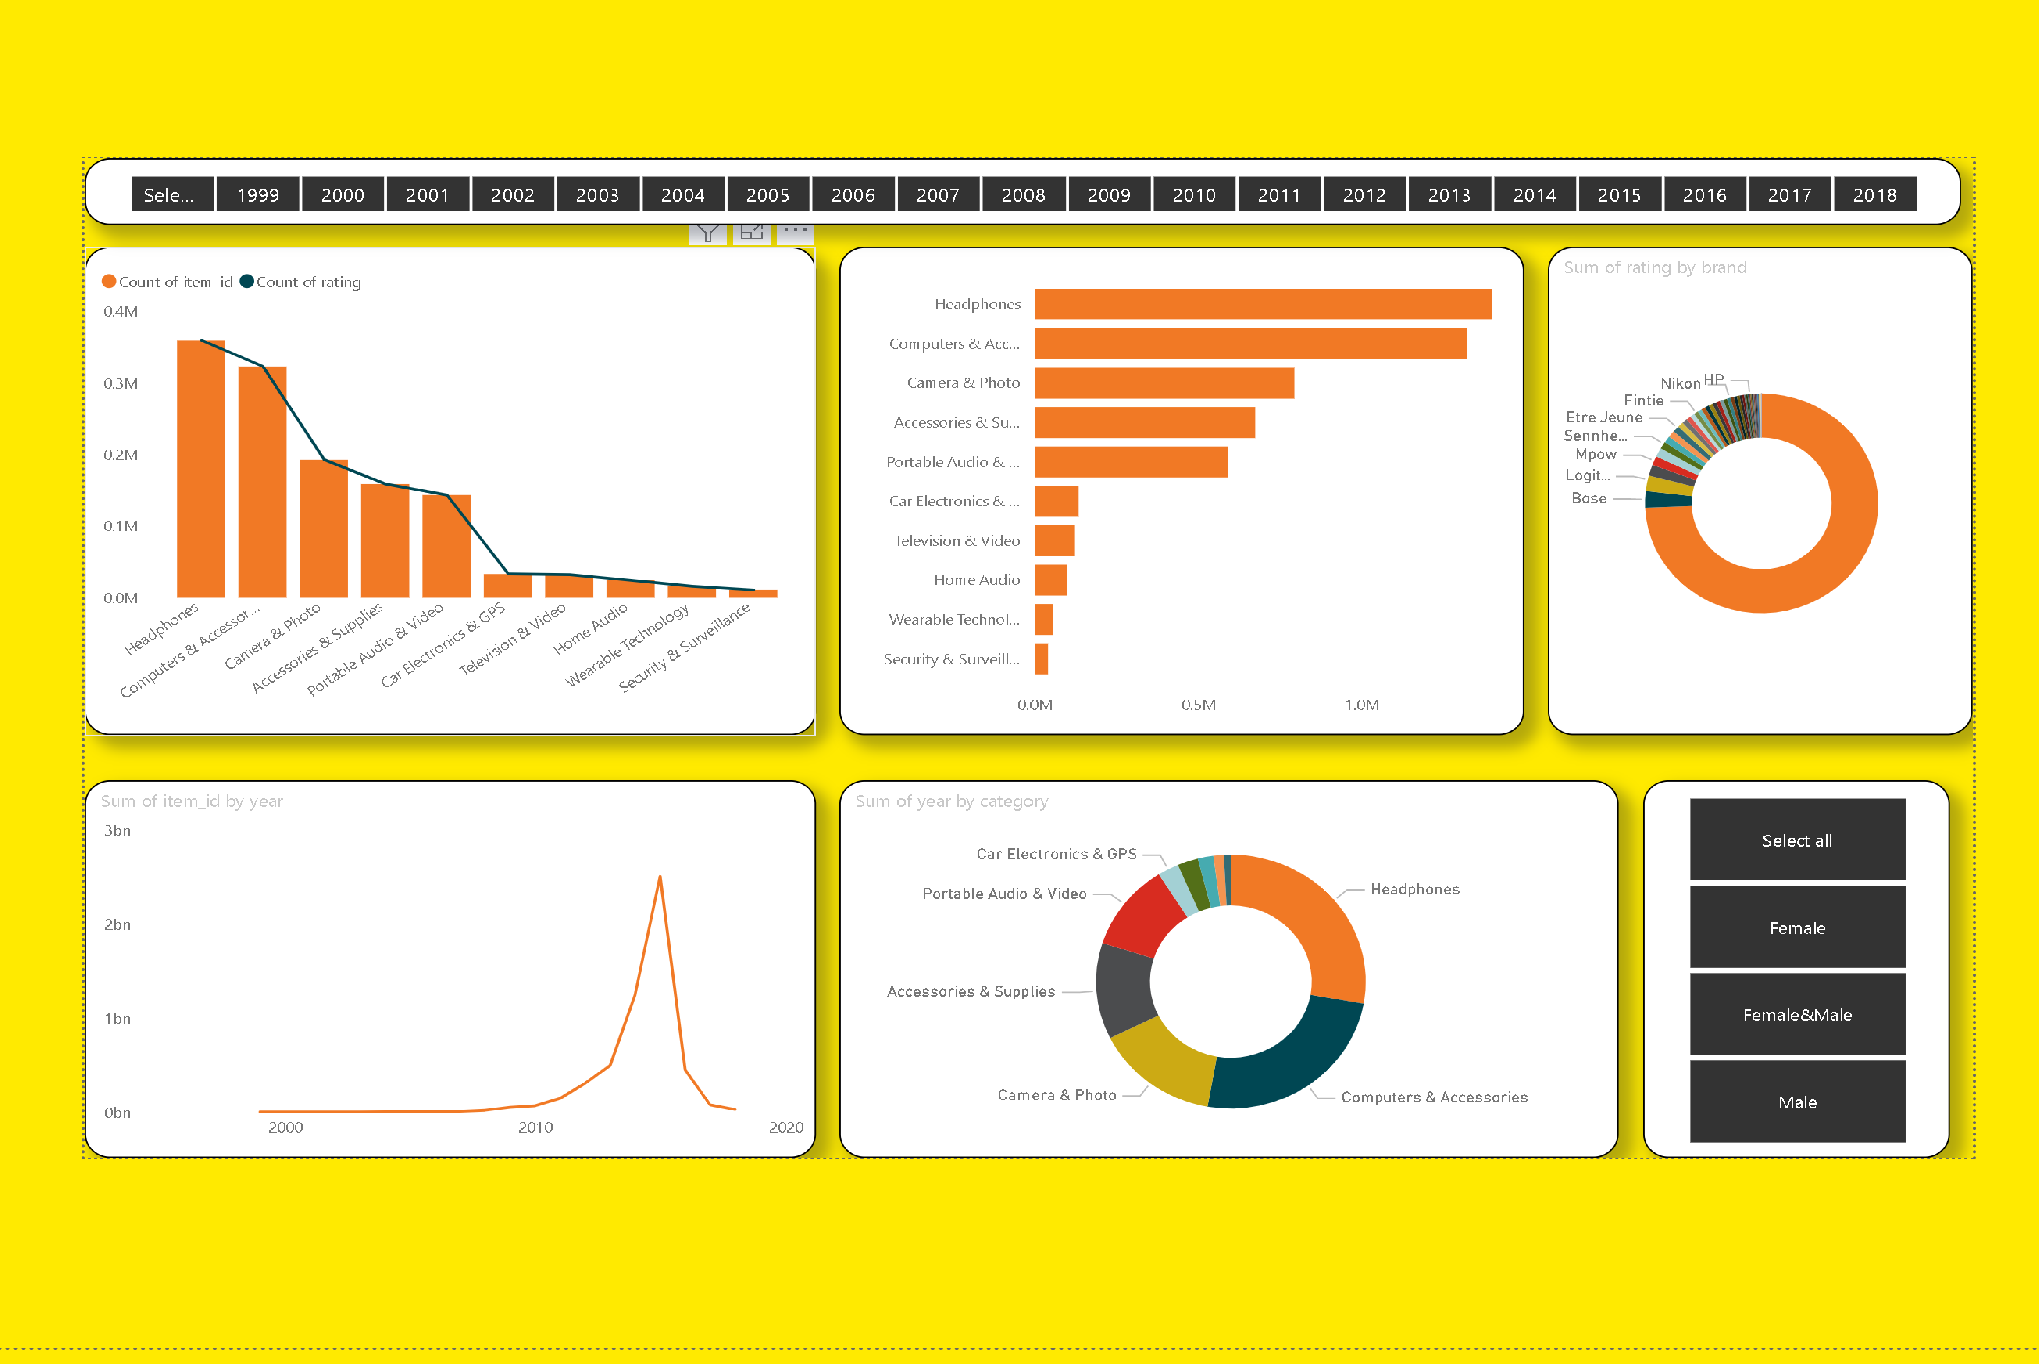
Once the data has been cleaned and transformed using SQL, Power BI can be used to create interactive visualizations and dashboards. Power BI is a business intelligence tool that allows users to create interactive dashboards and reports with a variety of data visualization options, including charts, tables, maps, and pivot tables.
One of the key features of Power BI is its ability to connect to a variety of data sources, including relational databases and cloud-based data services. This allows data to be easily imported and combined into a single data model for analysis and reporting.
Power BI also provides a number of interactive visualization options, allowing users to explore and analyze data in real-time. For example, a line chart can be used to visualize changes in sales over time, or a bar chart can be used to compare the sales of different regions. These visualizations can be further enhanced with drill-down capabilities, allowing users to click on data points for a closer look.
In addition to its visualization capabilities, Power BI also provides advanced features such as data modeling and advanced analytics. This includes the ability to create calculated columns, perform time series analysis, and create predictive models using machine learning algorithms.
SQL and Power BI are two powerful tools that can be used together to clean and visualize data. SQL provides a set of commands for cleaning and transforming data, while Power BI provides a rich set of visualizations and interactive dashboards for exploring and analyzing data. By using these tools together, organizations can gain valuable insights into their data, leading to more informed business decisions.
The full project fill can be accessed here: https://github.com/SamerKharboush/amazonsales
Insurance-Cost-Prediction Health Insurance Cost Prediction and Regression
Read MoreData is the lifeblood of many organizations and the quality of that data can greatly impact the decisions made from it. The process of cleaning and transforming data is known...
Read More
Disease-diagnosing-Prediction using machine learning different alghorithms to predict disease. Currently this app is deployed in a Tkinter App, and provides 3 different high accurate clinical diagnosis based on 3 different...
Read More